
Choosing a CPA network often looks simple at first glance. You open the network dashboard, scan a few offers, and naturally your eyes stop at the highest payout. Many affiliates do exactly that. But if you’ve worked with affiliate traffic even a little, you probably noticed something strange - the highest payout rarely leads to the highest profit. Real revenue depends on several metrics working together, and ignoring them can easily turn a promising campaign into a losing one. This article explains how to compare CPA network payouts, EPC, and approval rates properly so that you can estimate real profit and risk before spending serious traffic. The goal here is not theory but a practical decision framework affiliates can actually use. Some of the numbers might look messy or uncertain - honestly, they often are - but with the right approach you can still make much better decisions.
What to compare and what to ignore
If someone asks how to compare CPA networks quickly, the short answer is this: never compare payout alone. A payout number by itself does not tell you whether an offer will perform well with your traffic. It only shows the amount you earn per approved conversion, which is just one piece of the puzzle. In real campaigns, profit is influenced by conversion rate (CVR), approval rate, and sometimes operational factors like validation delays or caps.
EPC, or earnings per click, is often presented as the “ultimate” metric in affiliate dashboards. In theory it reflects the real performance of an offer. In practice, EPC can be misleading because it aggregates different traffic types, skill levels, and time windows. One affiliate might generate highly targeted SEO traffic, while another sends broad social traffic, and the network averages both results.
The more reliable approach is to think in terms of expected value per click. In other words, how much money each click is statistically likely to generate after approvals and validations. This approach forces you to consider conversion probability rather than just the payout headline.
Another thing affiliates sometimes ignore is the difference between approved conversions and paid conversions. Those two numbers can diverge more than people expect. A campaign might look profitable in the dashboard during week one, only to lose half its revenue during the validation period.
So the real comparison should always involve multiple metrics together. When affiliates compare CPA network payouts, EPC, and approval rates simultaneously, they start seeing the bigger picture. And that picture, occasionally, looks quite different from what the dashboard first suggests.
Step 1: Do your research (where numbers come from and how they get distorted)

Before comparing networks, it helps to understand where the numbers actually come from. The metrics you see in the reporting dashboard are aggregated statistics, not guarantees. They represent past performance across multiple affiliates and traffic sources. Because of that, the numbers can sometimes be distorted or overly optimistic.
For example, a dashboard EPC might be based heavily on content traffic. Articles reviewing financial products, for instance, tend to attract users already looking for loans or insurance quotes. That audience converts much better than cold traffic from social feeds. If you are planning to run social or native traffic, the dashboard EPC could be unrealistically high for your situation.
Time windows also matter more than many affiliates realize. Networks commonly show EPC calculated over seven or thirty days. A short window might reflect a temporary spike caused by one strong campaign or a limited promotion. When traffic stabilizes later, the number often drops.
Another subtle distortion appears with small sample sizes. Imagine an offer that generated just a handful of conversions recently. The resulting EPC might look impressive simply because a few high payouts happened during a small traffic window. When volume increases, the metric often settles into something more modest.
There is also the question of traffic quality. Some affiliates send highly optimized funnels with strong pre-sell content. Others send broader traffic that converts less efficiently. Both results feed into the same network statistic. The affiliate looking at the dashboard may not realize how wide that performance gap actually is.
Step 2: Analyze the basics

To compare CPA network metrics properly, it’s necessary to define the three core metrics clearly: payout, EPC, and approval rate. These terms appear simple, but their interpretation can vary slightly between networks. Misunderstanding them often leads affiliates to incorrect conclusions.
Payout refers to the amount you earn per approved action. Depending on the vertical, that action could be a completed application, a qualified lead, or a sale. In finance offers, for example, a payout might be paid after a loan application passes validation checks. In mobile app campaigns, the payout might occur after an install or registration.
EPC, which stands for earnings per click, measures the average revenue generated from each click sent to the offer. The formula is straightforward: total earnings divided by total clicks. However, EPC reflects the entire funnel performance, including conversion rate and approval rate. Because of that, EPC can fluctuate heavily depending on the traffic source and targeting accuracy.
Approval rate indicates the percentage of conversions that get accepted by the advertiser after validation. Some networks also distinguish between approved and paid conversions. The difference may appear minor, but it matters when validation rules are strict or when fraud filters remove leads later.
Before comparing networks, it’s helpful to think about the relationship between these metrics. In practice, they interact through a fairly simple economic principle: expected revenue per click.
To make this clearer, consider a simplified comparison example.
|
Metric |
Network A |
Network B |
|
Payout |
$120 |
$90 |
|
Conversion Rate |
1.1% |
2.0% |
|
Approval Rate |
60% |
85% |
|
Estimated Earnings per Click |
$0.79 |
$1.53 |
In this scenario, Network A appears attractive because of the higher payout. Yet Network B actually produces almost double the revenue per click because it converts more easily and approves more leads. This kind of analysis is exactly why affiliates should compare CPA network payouts alongside EPC and approval rates instead of evaluating them separately.
Step 3: Deep-dive factors that change ‘real’ EPC

Even after calculating expected value, several operational details can significantly influence the final result. These factors are sometimes hidden in the terms page or discussed briefly by the affiliate manager. Ignoring them can produce unpleasant surprises once traffic scales.
One major factor is the validation period. Many advertisers review leads over several days or weeks before confirming them. During this time, conversions remain in a pending state. If the validation rules are strict, a portion of those leads may later be rejected, lowering the effective approval rate.
Another factor is the hold period, which determines how long funds remain locked before payment. A network offering net-30 payments may delay revenue for a month, while another might release funds much faster. For affiliates running paid traffic, this difference can influence cash flow and scaling capacity.
Tracking reliability also deserves attention. If the attribution system fails to capture conversions correctly, EPC will appear lower than it actually is. Cookie windows, postback delays, and cross-device tracking issues occasionally cause such discrepancies. It is not extremely common, but it happens often enough that experienced affiliates check tracking carefully during early tests.
Caps and throttling mechanisms can also distort performance. Some advertisers limit the number of daily leads they accept. When the cap is reached, additional conversions might be rejected or redirected to lower-paying offers. As a result, the early performance metrics look excellent but degrade once the campaign grows.
Compliance rules form another layer of complexity. Certain verticals - especially finance, insurance, and subscription services - enforce strict data validation. Minor mistakes in the funnel or messaging may lead to higher rejection rates. \
Because of that, the same offer can produce very different approval rates depending on how traffic is generated.
Build a CPA Network Comparison Scorecard
At some point affiliates realize that comparing networks mentally becomes confusing. Too many variables interact at once. A simple scorecard helps bring structure to the decision process. The idea is straightforward: collect the key metrics from each network and evaluate them side by side.
Before creating such a scorecard, it helps to gather information from the network dashboard, the offer terms page, and sometimes directly from the affiliate manager. Some of the data might require estimation, especially conversion rates, but approximate numbers are usually sufficient for early comparisons.
Once the information is collected, the next step is to calculate expected value per click and note any operational risks. This process may feel slightly tedious, but it prevents decisions based purely on intuition.
The following steps describe how affiliates typically build their comparison framework.
-
Collect the headline metrics from the network dashboard: payout, EPC, and approval rate.
-
Estimate conversion rate based on traffic type and funnel expectations.
-
Calculate expected value per click using payout × CVR × approval rate.
-
Record operational details such as hold period, caps, and payment terms.
-
Add qualitative notes about support quality and responsiveness of the affiliate manager.
After filling in these elements, the differences between networks become much clearer. Sometimes the network with the highest EPC also has long hold periods or strict caps that limit scalability. In other cases, a slightly lower EPC combined with faster payments may provide more stable long-term performance.
Step 4: Test before you scale (a 7–14 day validation plan)
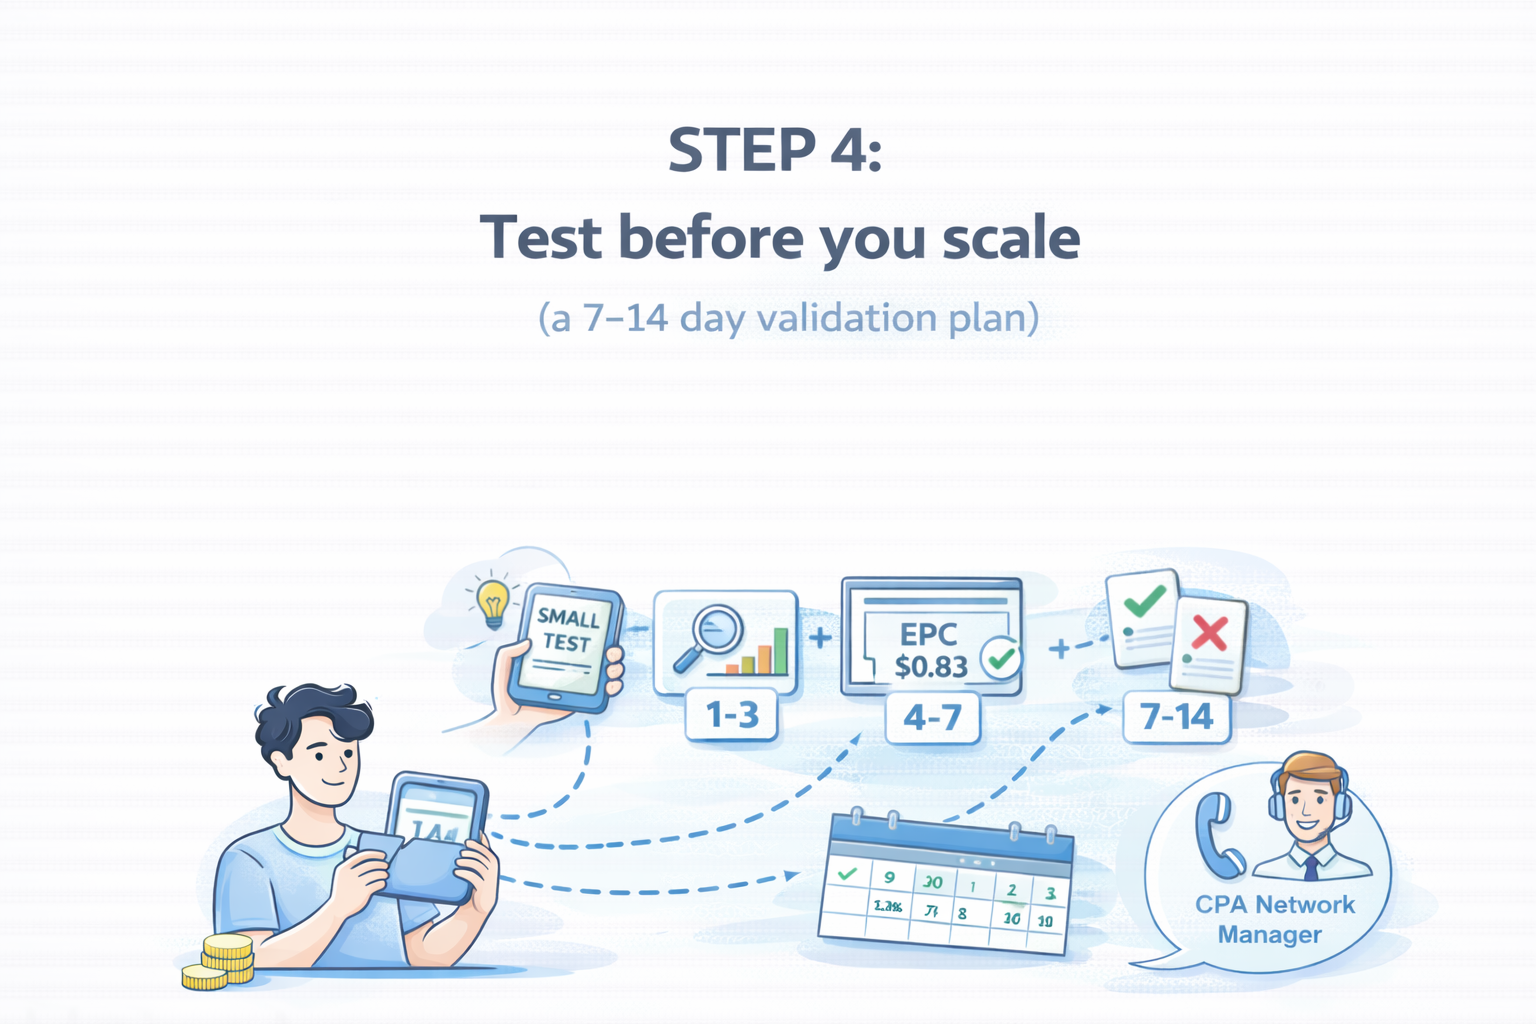
Even the most careful comparison cannot fully predict real campaign performance. Traffic behavior always introduces some uncertainty. That is why experienced affiliates almost always run a controlled test before committing serious budgets.
A typical validation period lasts between one and two weeks. The exact duration depends on traffic volume and the speed of advertiser approvals. During this time, the goal is not maximum profit but reliable data.
The early phase focuses on confirming that the tracking setup works correctly. Clicks must appear in the reporting dashboard, and conversions should register without delays. If discrepancies appear, they are easier to fix before large volumes of traffic are involved.
The middle stage of testing usually involves optimization. Affiliates adjust targeting parameters, creatives, or landing pages to stabilize the conversion rate. Performance tends to fluctuate slightly at this stage, which is normal.
By the end of the test period, several indicators should become clearer: average EPC, approval rate trends, and potential compliance issues. Only after these signals look stable does scaling begin.
A simple testing workflow might look like this:
-
Launch a small campaign generating around 100–300 clicks per day.
-
Monitor conversion tracking and confirm that leads appear correctly.
-
Optimize targeting and creatives over several days.
-
Observe approval rates once initial validations start arriving.
-
Increase traffic gradually only after the metrics remain consistent.
This approach might feel cautious, but it protects affiliates from scaling campaigns that later collapse during validation.